


22% fall in live TV watching in three years
TV screen usage has reached its lowest point in four years, with Australians spending an average of 111 hrs and 3 minutes per month watching content on TV screens.
The results come from the first Australian Video Viewing Report by Regional TAM, OzTAM and Nielsen, which succeeds the quarterly Australian Multi-Screen Report from previous years.

The new quarterly report succeeds the Australian Multi-Screen report.
Even including catchup viewing, TVs are being used for an average of ten hours less per month – a fall of more than 8% over the last four years.
The first results for 2017 suggest while 83% of Australians watch some broadcast TV on in-home sets, total TV screen use is at its lowest point since the quarterly numbers became available at the start of 2013.
In the first quarter, monthly viewing showed a 6hr and 27 minutes year on year decline, with Australians using the TV screen for 111 hrs and 3 minutes a month, down from 117 hours and 30 minutes the year before.
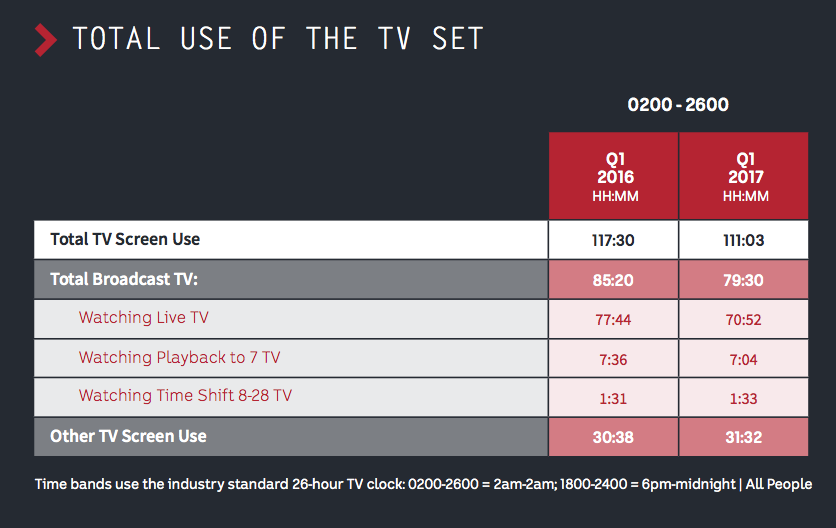
Total TV Screen Use saw its biggest year on year decline in four years. Source: Australian Video Viewing Report Q1 2017
Live broadcast TV has seen an even bigger fall – down from a high of nearly 90 hours per month three years ago, to around 70 hours in the most recent quarter – a fall of 22% in just over three years.
Playback within seven days was the only area to remain relatively stable, with Australians consuming 7hrs and 4 minutes compared to last year’s 7hrs and 36 minutes.
However, television remains a powerful medium, with the numbers suggesting the average Australian spends the equivalent of four-and-a-half days a month watching TV.
Other results show 1-2% of broadcast TV content viewed each week takes place on connected devices – as measured by OzTAM’s Video Player Measurement (VPM) data.
OzTAM VPM data – which captures minute-by-minute viewing of participating broadcasters’ free online ‘catch up TV’ (video on demand) and live-streamed content across multiple devices – covers broadcasters including the ABC, Seven Network, Nine Network, Network Ten, SBS and Foxtel.
The results suggest more content is viewed online during the day on weekends, compared to weekdays, and catch up activity peaks later in the evening.
Devices used most for online video viewing are tablets, smart phones and desktops/laptops.
Active online Australians aged 2+ spend 13 hrs and 4 minutes per month watching video on desktop/laptop.
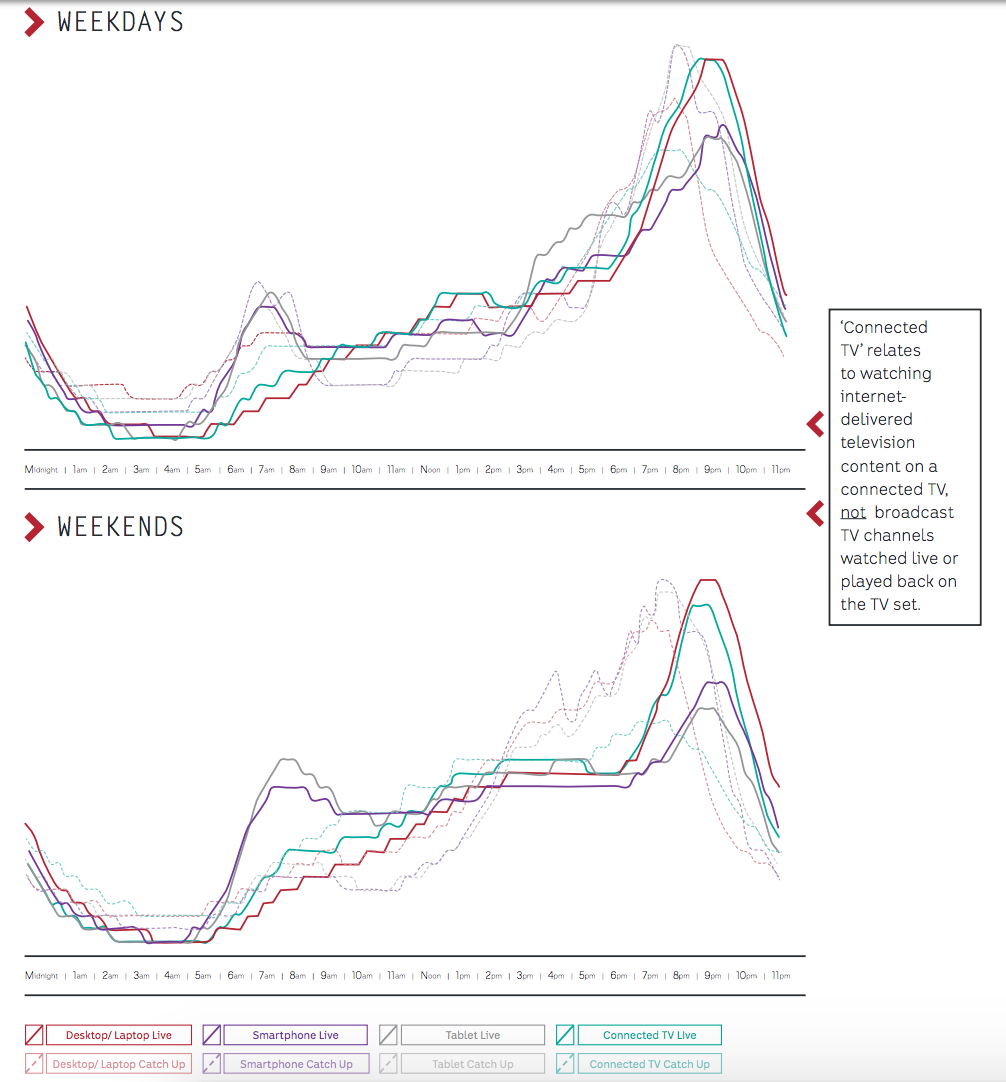
Viewing patterns on ‘connected devices’ Source: Australian Video Viewing Report Q1 2017.
The age group using desktop/laptop most are the 18-24s, at 22 hrs and 4 minutes monthly, ahead of the 25-34s, who watched 20hrs and 4 minutes of video on desktop or laptop each month.
The 65+ age demographic and teenage demographic are least likely to watch video on desktop/laptop reporting 6 hrs and 8 hrs 39 minutes a month respectively.
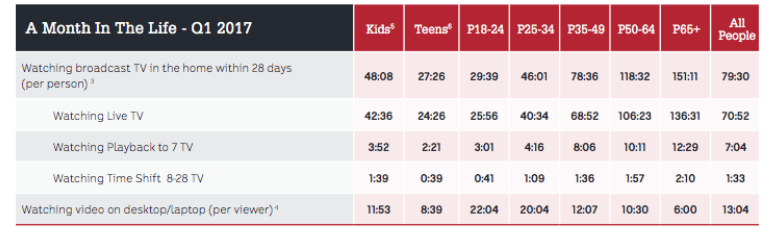
A Month In the Life. Source: Australian Video Viewing Report Q1 2017
Craig Johnson, regional managing director for media at Nielsen said the latest results suggest content providers and advertisers need to be “flexible” in their approaches to reaching consumers.
“As we move through 2017 we’ve continued to see growth of Australians aged 18-24 engaging with video content online.
“This is certainly reflected in video viewing on mobile devices with this group now spending more than nine hours a month watching video via a smartphone – making them the biggest consumers of mobile video content,” Johnson said.
OzTAM’s CEO, Doug Peiffer, added: “As people embrace device and platform choice, for some these new options actually create more time to stay up to date with their favourite TV programs or watch other video – for example, while commuting or taking a few minutes out during their lunch break.
“Although connected screens and endless content options contribute to the gradual decline in the time people spend watching live and time-shifted TV, particularly for younger viewers, nearly all Australians watch broadcast TV each week. On average across the total population TV remains the most-watched screen.”
In addition to the results,OzTAM, Regional TAM and Nielsen has added a new demographic to their quarterly report – ‘Total Grocery Shoppers’ – to better reflect changing grocery buying patterns.
Reasons for the additional demographic include people delaying marriage and children, more households where parents work, young adults leaving home later, growing share households, busy schedules, online shopping and more creativity in cooking.

‘Grocery Buyer’ profiles Source: Australian Video Viewing Report Q1 2017
topics
Australian Video Viewing Report
Craig Johnson
Doug Peiffer
Nielsen
OzTam
Regional TAM
Tony Hogarth
To me the most interesting figures are the demo splits of those watching broadcast TV:
* 151 hours per month for 65+
* 118 hours per month for 50-64
versus
* 27 hours for teens
* 29 hours for 18-24
User ID not verified.
“This is impossible, this is BS!” I hear Mark Ritson saying, before taking his small, Swiss leather tape measure out for his morning ritual.
https://www.marketingweek.com/2017/06/13/mark-ritson-digital-metrics-bullshit/
Let’s hope his size is not related to TV viewership.
On that note, go mobile!
User ID not verified.
I would like to hear from Mark Ritson regarding this article.
User ID not verified.
Does Mark Ritson only comment on data which supports his opinion?
User ID not verified.
Anyone that believed the horse shit that Ritson shovelled deserves the hard bounce.
But he’s just part of the broadcast-advertising-complex which is as crooked as they come
https://www.wsj.com/articles/in-tv-ratings-game-networks-try-to-dissguys-bad-newz-from-nielsen-1499350955
User ID not verified.
It’s simply a reflection of the poor quality content being offered up by FTA broadcasters now days – divisive programming produced for the advertisers and not the audience – which the audience is saying NO to on an increasing basis (Network bosses wake up)
And the age group that is familiar and comfortable with finding their own content, do so – whilst unfortunately the older demos get served up ‘slop’ they continue to try and force feed themselves with…
Fortunately GEM still offers some respite for the time being…
User ID not verified.
to get a true view here it would be good to understand what has happened to prime time viewing in this period as this is where the bulk of advertising investment goes.
User ID not verified.
As I appear to have been summoned,
1. Clearly the amount of time Australia spends watching TV is in decline. The argument is that the decline is not terminal – despite what the headlines regularly tout – and does not mean mean TV is anything other than the pre-dominant source of video (and therefore video advertising) for most Australians. Yes a 22% is a bigger fall than most expected and should be significantly examined.
2. But if you move on from the 22% headline and actually read the report itself you would see that the data there confirms that while the total time spent watching TV is declining it is doing so from an unparalleled position of dominance. Australian video consumption in Q1 2017 consisted of;
Laptops/PCs 13%
Tablets 3%
Mobile 3%
TV 81%
While the -22% degradation has obviously had an impact, can I once again make the combined points that;
a) The only timeline that marketers should concern themselves with is 2018 brand planning
and
b) For that time period TV represents a massively dominant source of video exposure whereby for every hour of video watched on a mobile screen, there are almost 30 hours being watched on TV.
I thank you.
User ID not verified.