As ever, this post is brought to you in association with RALF from DP Software and Services. I’ve used RALF for the past 9 years, and it’s my favourite RAJAR analysis tool. So I am delighted that I continue to be able to bring you this RAJAR analysis in association with RALF. For more details on the product, contact Deryck Pritchard via this link or phone 07545 425677.
RAJAR is upon us once more, and so this will be something of a canter through the results. However, I’ll also throw in a few pieces from the most recent RAJAR MIDAS survey that was also recently published, and is very illuminating.
I think I will start with digital listening, since we’re now incredibly close to half of all radio listening being on a digital platform. In this quarter it reached a high of 48.7% of all listening being digital, up from 47.2% last quarter and 45.3% a year ago.
You can see from this chart that progress has been constant over that time. And of course DAB radio is the largest part of that listening. But it’s always worth having a look at internet listening, because that seems to be growing much faster. Apps improve, and data packages increase. You may even have seen improved 4G coverage!
Internet listening is now up to 8.8% of all radio listening. Also a new high.
If you just look at 15-44s, then internet listening goes up to 14.6%. This is becoming an important platform.
Overall 49.2m people listen to the radio each week – an all time high. Although we should be careful to note that RAJAR updates its population estimates in Q2 each year, and as the UK’s population continues to rise, you would expect listening to rise – even if radio listening is actually “flat.” And so it is that 90% of the population listen to the radio, which is in line with previous quarters.
Each radio listens for 21.0 hours a week, which actually represents – just – a record low under the current RAJAR methodology. This isn’t necessarily surprising, since as I’ve said here before, it’s not so much reach and listening hours that are challenging radio the most, particularly in younger demos. But average hours are worth keeping an eye on.
National and Digital Services
Radio 1 will be pleased to have bounced back from some awful results last time around. They are back up to nearly 9.6m listeners, representing an increase of 5.3% on the quarter and a 1.4% increase on the year. In terms of listening hours, they’ve done very well this time with 64.3m hours which is the best they’ve had for nearly two years now. Last quarter does look much more like a “blip”, but this audience remains challenging and other metrics undoubtedly come into play as far as the station goes.
Radio 2 saw a small decrease across the board in its listening figures, with a fall below 15m for the first time in a few quarters. Notably hours fell too, down 6.0% on the quarter and down 3.0% on the year. But with 14.8m listeners tuning in for an average of 11.7 hours a week, they’re not exactly struggling. Obviously we do now know that their presenters are generally fairly well remunerated!
Radio 3 saw its reach breach 2m again, up 9.4% on the quarter, yet down 6.3% on the year in reach terms. There was a similar trend with hours.
Radio 4 had a stronger quarter in reach terms, rising to 11.6m. By the skin of its teeth, that’s a new record reach for the station, breaking the previous reach set in Q2 last year. Obviously there continue to be one or two things in the news which may well be helping. Hours were down a bit on the quarter, however, while being up on the year.
Five Live had a second successive disappointing quarter, being fractionally down in reach on the quarter, but more substantially down on the year. They’ll be keeping an eye on hours too, with 35.0m down 14.5% on the 41.0m they had a year ago. Obviously there’s no major football tournament this year, and the end of the football season wasn’t quite the story it was a year ago.
In a massive shock, 6 Music has somehow not achieved a record audience this quarter! Reach is down 4.9% to 2.2m, while hours dip below 20m. The latter in particular feels a bit like a blip and will be worth returning to next quarter.
I’ll note that the World Service is up 19.4% in reach terms this quarter, and 28.5% up on the quarter in terms of hours.
LBC has had another exceptional quarter, up 14.5% to 2.0m, and up 11.8% to 21.6m listening hours. These are both records in terms of the station in modern times, since it went national. The station really is going from strength to strength.
Absolute Radio was down 3.0% on the quarter and a little more on the year to 2.1m, while hours were down 1.8% on the quarter, but up 15.8% on the year. Absolute obviously has Dave Berry beginning his new drivetime show from this October, while this quarter (just) saw the departure of longtime presenters Geoff Lloyd and Annabel Port from that slot. We won’t truly be able to see the outcome of that change until the Q4 figures come out early in 2018.
Classic FM had a strong quarter with reach up 7.8% to 5.8m, while hours were up nearly 16% to 40.3m. Those both represent the best numbers the station has had since the first half of 2011, so a really great set of results for the team in Leicester Square.
Talksport on the other hand, has not had a good set of numbers this quarter. They’re down 3.9% in reach on the quarter, and down 20.3% in reach on the year. Hours are worse, down 16.6% on the quarter, and down 28.2% on the year. As with Five Live, there’s been no major football tournament this summer, and the end of the season wasn’t perhaps as exciting as in some other years. However, the reach is the worst since 2010, and hours the worst since the end of 2003. You must think that News UK can help the station with some solid marketing, but also wonder if we’ll see some significant programme changes. Some of those audience losses can be balanced against some growth in Talksport 2, which achieved its best results so far, with 336,000 reach and just short of 1m hours.
Talkradio has also seen some positive shifts, with its reach and hours both healthily up in percentage terms. It now has 275,000 reach with 1.1m hours. Those results put the station about on a par with Virgin Radio which was down in reach but up in hours on the quarter. It has 364,000 listeners spending 1.1m hours with it. The challenge for Wireless Group (and owners News UK) was always supporting all these new brands over the early part of their existence. Speech radio in particular is not necessarily a cheap format.
The Capital Network jumps back up 3.8% in reach and 3.1% in hours this quarter, with the overall brand (including Capital XTRA) similarly improving. Overall they have a reach of 8.6m reach with 48.4m hours. Does Global have Radio 1 in its sights?
Sister Heart Network is basically flat in reach, and down 3.6% in hours on the previous quarter. The overall Heart Brand is up 2.8% in reach but down 0.9% in hours. It reaches 9.2m a week with 67.0m hours. A recent trip to the cinema suggest that they’re spending on the brand currently (although the cheery ad perhaps felt at odds with Dunkirk, which we were about to see).
Over at Kiss, reach is up 4.6% to nearly 4.4m, while hours are down slightly 2.8% on the quarter. The overall Kiss Network (including the very successful Kisstory which itself achieved record figures of 1.7m reach and 7.5m hours) is up 6.4% in reach although down 2.0% in hours.
The Magic Network has seen its audience grow 2.0% to 3.6m this quarter (down a little on the year), while hours have slipped 3.5% on the quarter and about the same on the year.
Finally let’s enter the battle of the 80s. Absolute 80s has increased its reach this quarter by 11.3% to 1.5m, although it’s slightly down on the year, and hours have fallen 9.4% to 7.4m. They’re the lowest they’ve been since Q3 2014.
So what’s happened, and why did I call this a battle? Well Heart 80s has happened. They’ve come in with a reach of 852,000, which is slightly over half the reach of Absolute 80s. Meanwhile they’ve got 3.9m listening hours – again just over half what Absolute 80s achieved.
I would imagine that Global will be delighted with those numbers, while Bauer is disappointed. I’ve mentioned previously that Bauer moved from the Digital One DAB multiplex to the presumably cheaper D2 multiplex. However, that multiplex covers significantly less of the population, and that move in itself saw a decrease in listening almost certainly as a direct consequence. In the meantime. Global saw an opportunity to put a new 80s service on Digital One, and Heart 80s is the result. You can assume that some listeners who lost access to Absolute 80s on DAB have now started listening to Heart 80s. While Absolute 80s is comfortably ahead as things stand, that has got to be a mini-battle worth watching in the future.
London
As ever, the biggest station in London in reach is… Radio 4. It’s up 7.4% in reach. But nobody ever wants to hear that. They want to know about the music stations.
The next biggest station in reach terms is Capital, who’ve had another great result, up 3.3% in reach 2.3m. Hours are up a bit too.
Kiss has had a good result this quarter, and is just behind (if we exclude Radio 2) with 2.0m listeners up 13.8% on the quarter, although down on the year. That’s quite a bounce back for Kiss. Hours are up a little too.
Then it’s Heart with 1.7m listeners, up an astonishing 21.9% after a couple of really poor quarters. Again, listening is down a little.
Skipping past Radio 1, we get to LBC with 1.4m listeners, up 31.6% this quarter, and up 9.2% on the year. But of course it’s the hours of LBC that really do well with 15.7m hours, it can rightly claim to be London’s most listened to commercial station (Radio 4 has more).
Absolute Radio is struggling in London right now with 637,000 listeners, down 17.6% on the quarter and more than 25% on the year.
But I’d finally just note that BBC London is up a colossal 88.8% on the quarter in reach terms and 156% in hours to 621,000 and 3.3m hours. Now while I’m dubious about massive jumps either up or down, 621,000 represents an all time record reach for the station under the current RAJAR methodology!
MIDAS
Finally, I thought that it was worth having a little look at the recently published RAJAR MIDAS survey. This examines listening against other types of audio listening, including on demand music streaming (OMS) services such as Spotify, mp3s, vinyl and so on. It’s important to note that the research is carried out separately to the main RAJAR survey, and as such, isn’t directly comparable. Nonetheless, the most recent set of data was published last week, and it seems as good a time as any to check out some numbers.
It’s always worth looking at the Share of Audio % which shows what radio is “up against.” Some might think that radio’s very retro, and that nobody listens to anything other than Spotify and podcasts, because that’s what they do as a cutting edge media-type. Of course this isn’t true as the chart below shows.
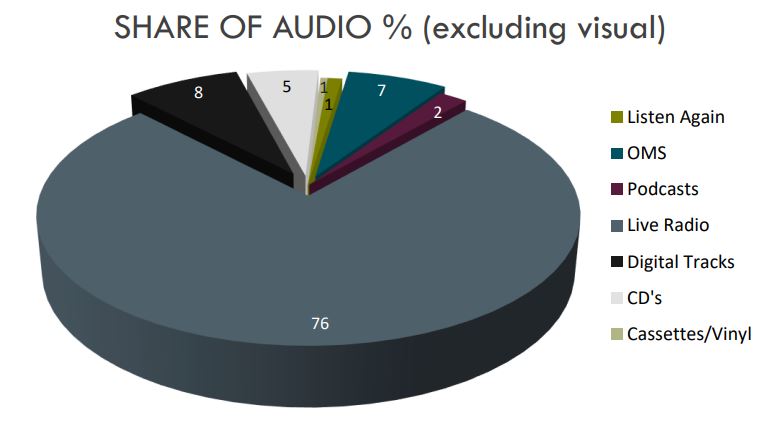
That chart shows that live radio dominates listening with 76% of (non-visual) audio. That’s down very slightly from 77% in the last spring release. Other facts that come out of the survey include:
- 26m people, or 49% of the population haved downloaded a radio app for their phone, with on average users have 2 apps.
- 5.6m adults listen to a podcast in any week, with smartphones being the most popular device. That’s up from 5.5m in the spring MIDAS survey.
- 4.2m adults use listen again or catch-up services.
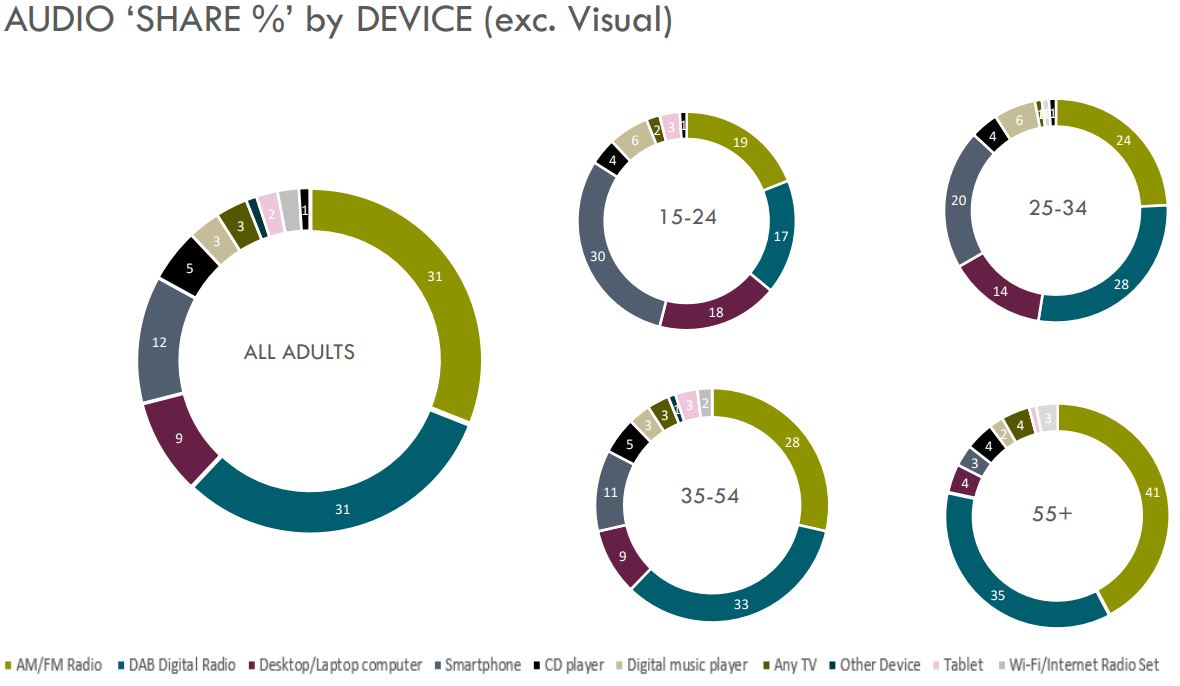
Obviously listening trends change substantially by age group.
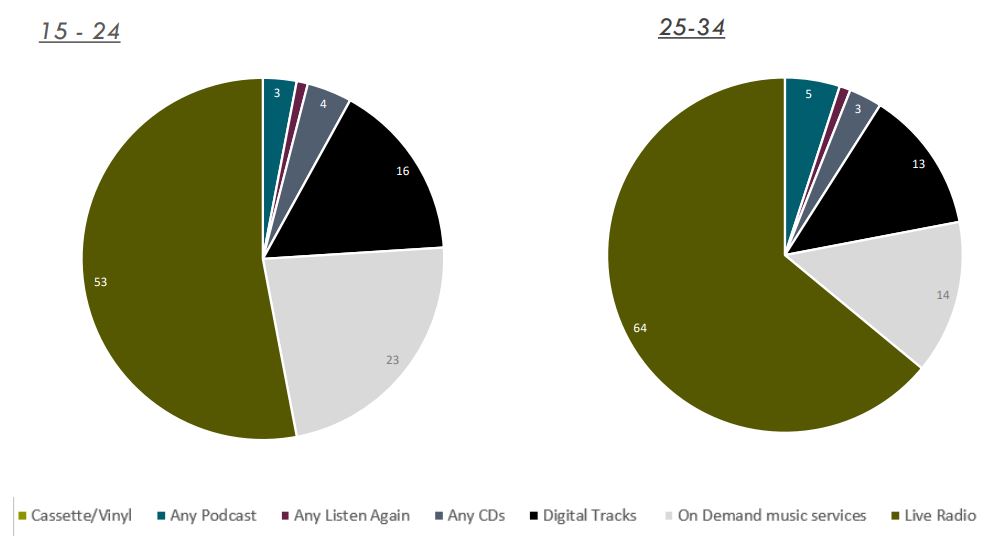
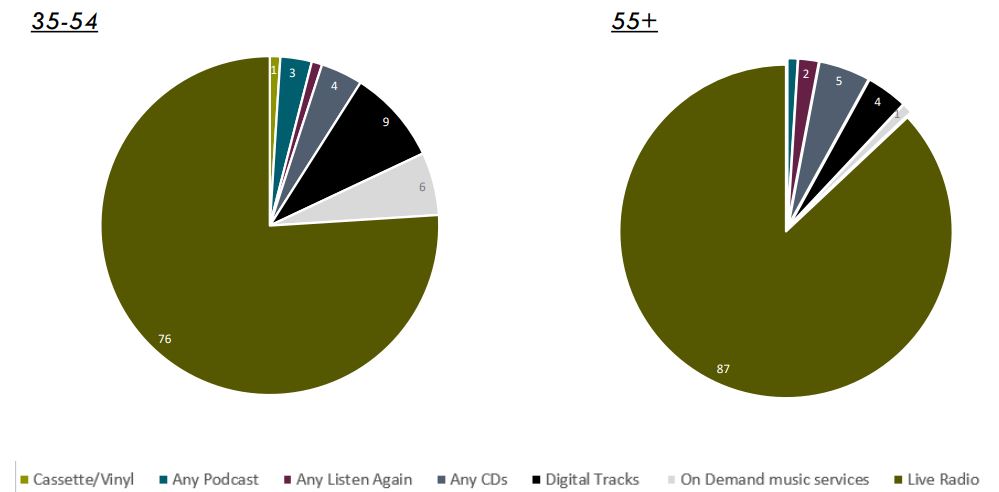
You can instantly see that OMS listening is the most significant difference between age groups. Amongst 15-24s, this listening accounts for 23% of all listening, while only accounting for 1% of listening amongst 55+’s.
The growth in listening to OMS amongst 15-24s is quite alarming. There’s no other way to put it, since in Winter 2016 it was 21%. How big will this slice of the pie continue to grow to?
What devices are people using? Well analogue and digital radios are at the top of the list in terms of share, but it really depends on how old you are. For 15-24s, the smartphone is key – and there’s often not a radio built into these (or if there is, it’s pretty bad). But computers are also really important for this group. Only 36% of their time is spend with traditional radios compared with 62% overall.
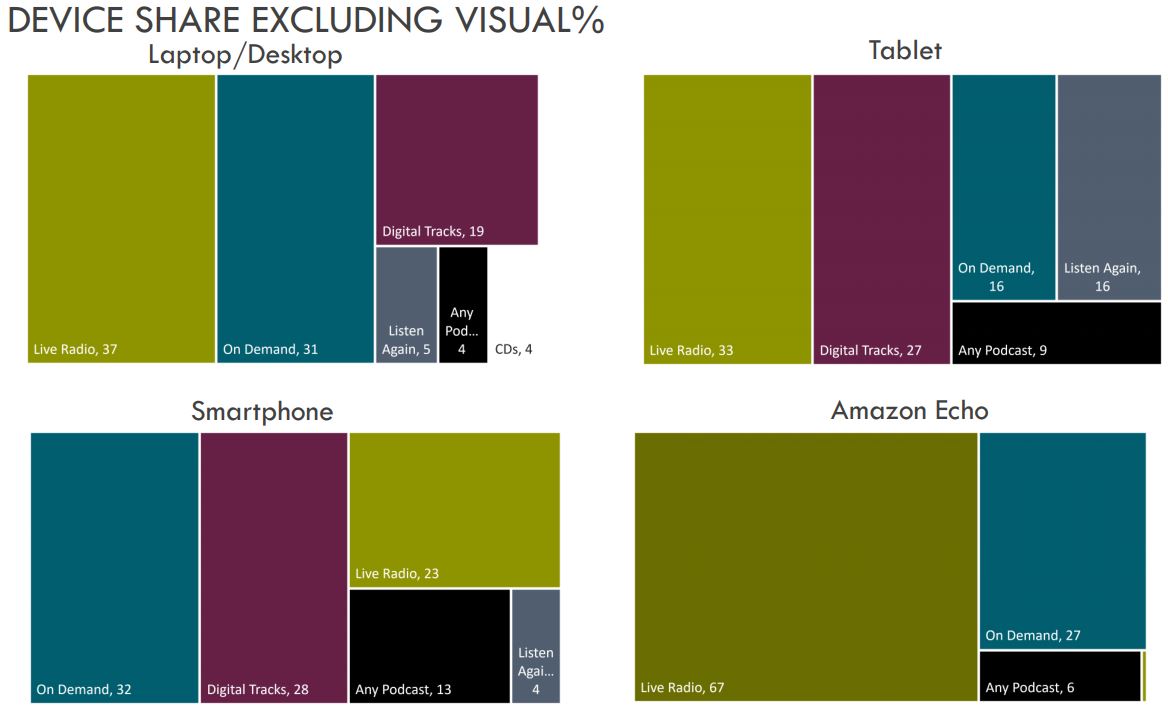
One final thing worth looking at is what people are listening to by device. I wanted to highlight this, because the Amazon Echo is included. Now, although I don’t have the full data tables for MIDAS research, I suspect that the Amazon data will be on very small sample sizes, so should be treated with caution. However, if it’s in any way indicative, it shows that Voice User Interface devices like the Echo could be very important ways of listening to the radio in the future. Ahead of any other internet connected device that MIDAS measured, more live radio was consumed on the Echo.
As someone who owns two Echos, I can attest to the fact that it’s easily the most painless way of listening to the radio full-stop. You just bark your order at the device and it starts!
(I will note that “digital tracks” don’t seem to show up in the Echo’s results, and since you can listen to services like Spotify and Amazon Music on the devices, I would be very wary of the absolute numbers here. Something to watch in future. [UPDATE: Actually, I was misreading the chart. The “On Demand” represents On Demand Music Services including Spotify. It’s actually personally owned Digital Tracks that you can’t really play via an Echo and is therefore missing – well you can but it’s very fiddly and limited. Thanks to Mike for pointing this out. I still suspect the sample is small, so would be wary of absolute numbers, but the fact remains that Live Radio is crucial part of the Echo audio experience.])
The full publicly available summary is available here on the RAJAR website.
Further Reading
For more RAJAR analysis, I’d recommend the following sites:
The official RAJAR site and their infographic
Radio Today for a digest of all the main news
Go to Media.Info for lots of numbers and charts
Mediatel’s Newsline will have lots of figures and analysis
Paul Easton for more lots analysis including London charts
Matt Deegan will have some great analysis
The BBC Mediacentre for BBC Radio stats and findings
Bauer Media’s corporate site
Global Radio’s corporate site
All my previous RAJAR analyses are here.
Source: RAJAR/Ipsos MORI/RSMB, period ending 25 June 2017, Adults 15+.
Disclaimer: These are my views alone and do not represent those of anyone else, including my employer. Any errors (I hope there aren’t any!) are mine alone. Drop me a note if you want clarifications on anything. Access to the RAJAR data is via RALF from DP Software as mentioned at the top of this post.
Comments
2 responses to “RAJAR Q2 2017”
Just a few lines to say a since and hearty ‘Thanks’ for the time you have obviously taken in assembling such a clear and incidive analysis of the RAJAR data.
Very usefuil, I’m most grateful.
Thanks your kind words Paul.